Dust
Hundreds of square miles of dry lakebed
Exposed lakebed blows into the air over the Wasatch Front. More than 120 square miles of Farmington Bay alone is exposed, including 21 square miles of known dust hot spots.[2]
Sector 01America at 250 · The next great build
The Great Salt Lake is running dry. Pacific Aquarius imagines bringing the Pacific to it, and building the biggest water park anyone has seen around the works.
A vision, not an approved project. Sponsored by Chiller Tech Support LLC.
Not so long ago, at a shrinking lake in Utah…
Chapter I
It is a time of drought. The Great Salt Lake has fallen to record lows, and dust lifts off its dry bed toward the cities on its shore.
A century ago, Americans built Hoover Dam and Glen Canyon to move the West’s water. Now, at 250, the country is looking for its next great build.
Pacific Aquarius imagines bringing the Pacific inland: the works hidden inside the biggest water park anyone has seen, with canals to carry the people. It is a vision, not yet a plan. Perhaps you will help build it…
Why this matters
In 2022 it hit its lowest level on record, shrinking from about 1,700 square miles to roughly 800.[4] Utah’s Strike Team found human water use explains most of the drop: an estimated 67–73%.[1]
4,191.1ft
End of 2025: a little better, still about 7 feet short of healthy.
Dust
Exposed lakebed blows into the air over the Wasatch Front. More than 120 square miles of Farmington Bay alone is exposed, including 21 square miles of known dust hot spots.[2]
Birds
Utah’s wildlife agency counts more than 10 million migratory birds, of about 250 species, passing through the lake each year.[5]
Brine shrimp
They feed fish and shrimp farms worldwide. At levels like today’s, the state’s lake-level guide flags harm to brine shrimp, and serious harm a little lower.[5][1]
Economy
A 2019 study for the state’s Great Salt Lake Advisory Council estimated what a sustained decline could cost Utah each year, along with more than 6,000 jobs.[6]
What recovery takes
To reach a healthy 4,198 ft within 20 years, the lake needs 500,000 to 1,100,000 extra acre-feet of water every year.[1] Utah has already sent nearly 400,000 acre-feet its way since 2021 through conservation, leasing, and new laws.[2]
Conservation is the fastest, cheapest help, and it comes first. Pacific Aquarius asks a longer-range question: what if the West also had a new source of water?
Seen from orbit
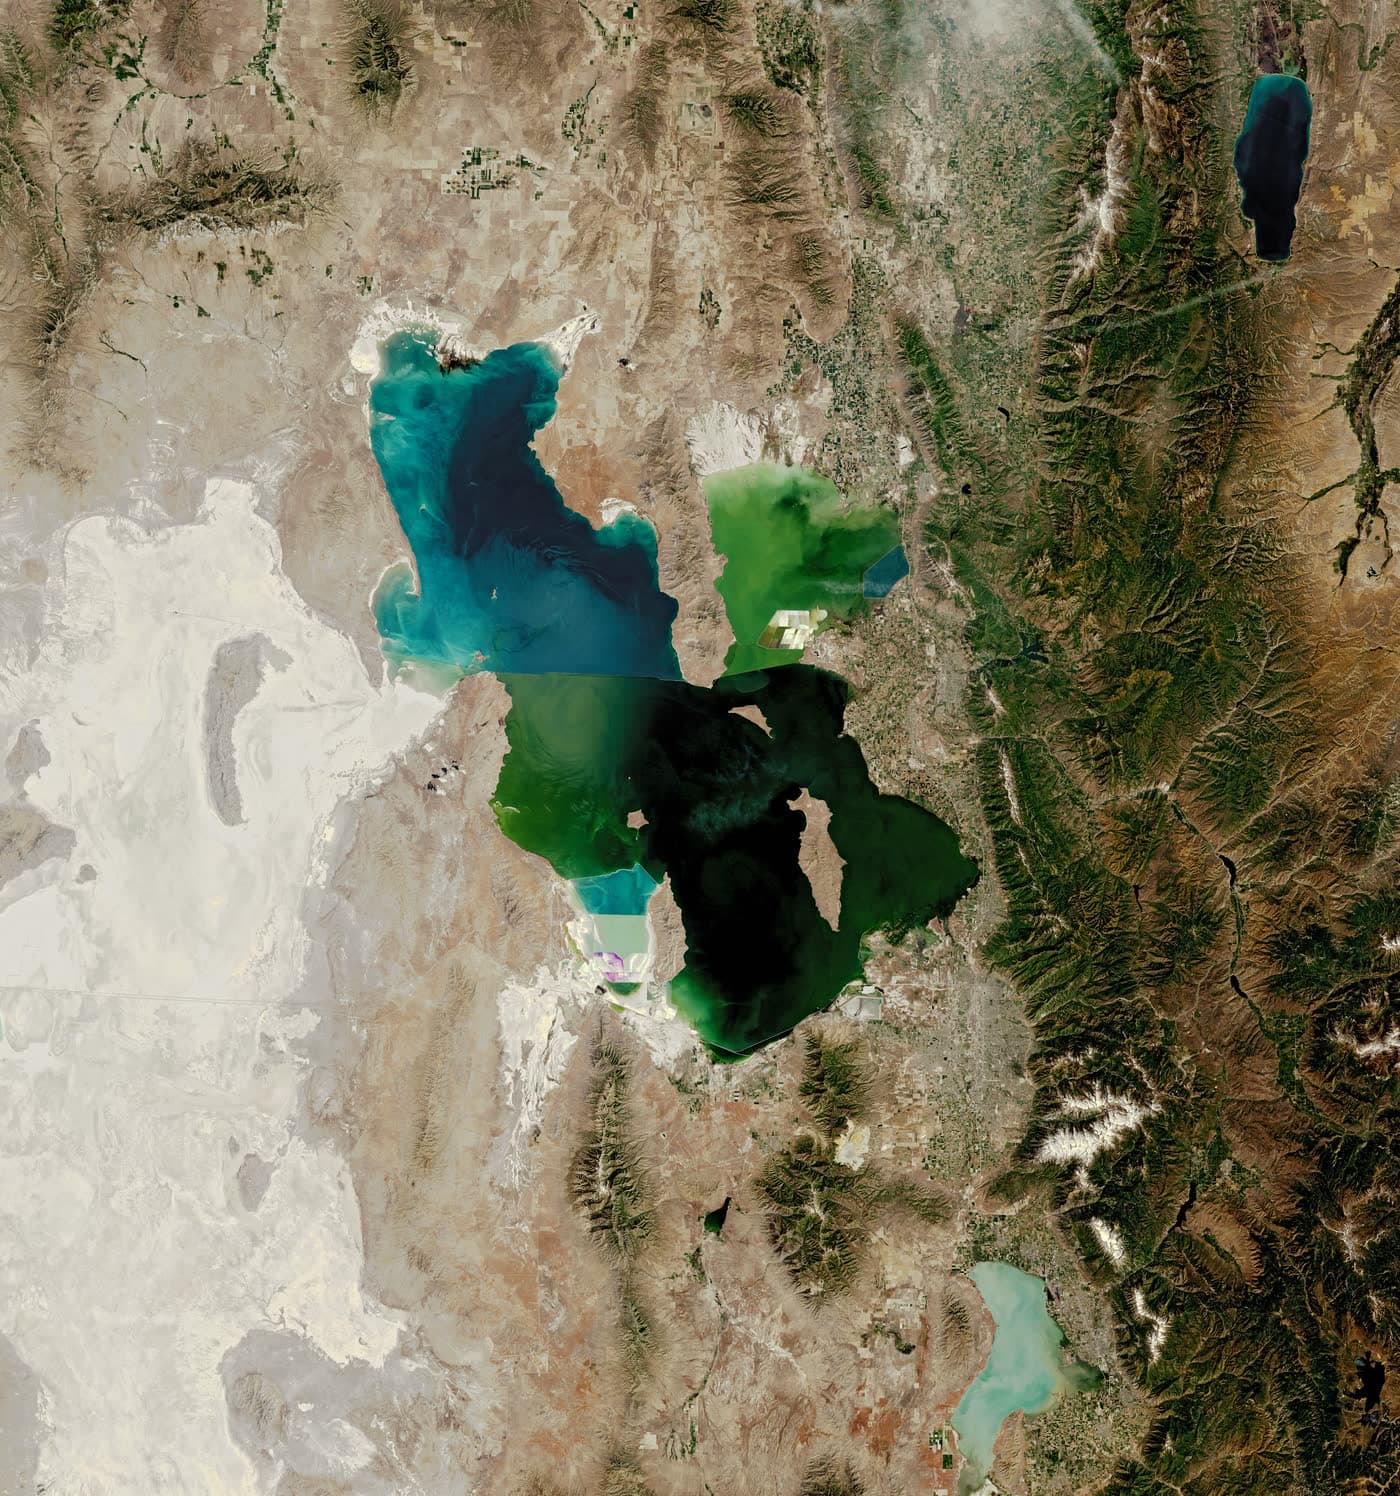
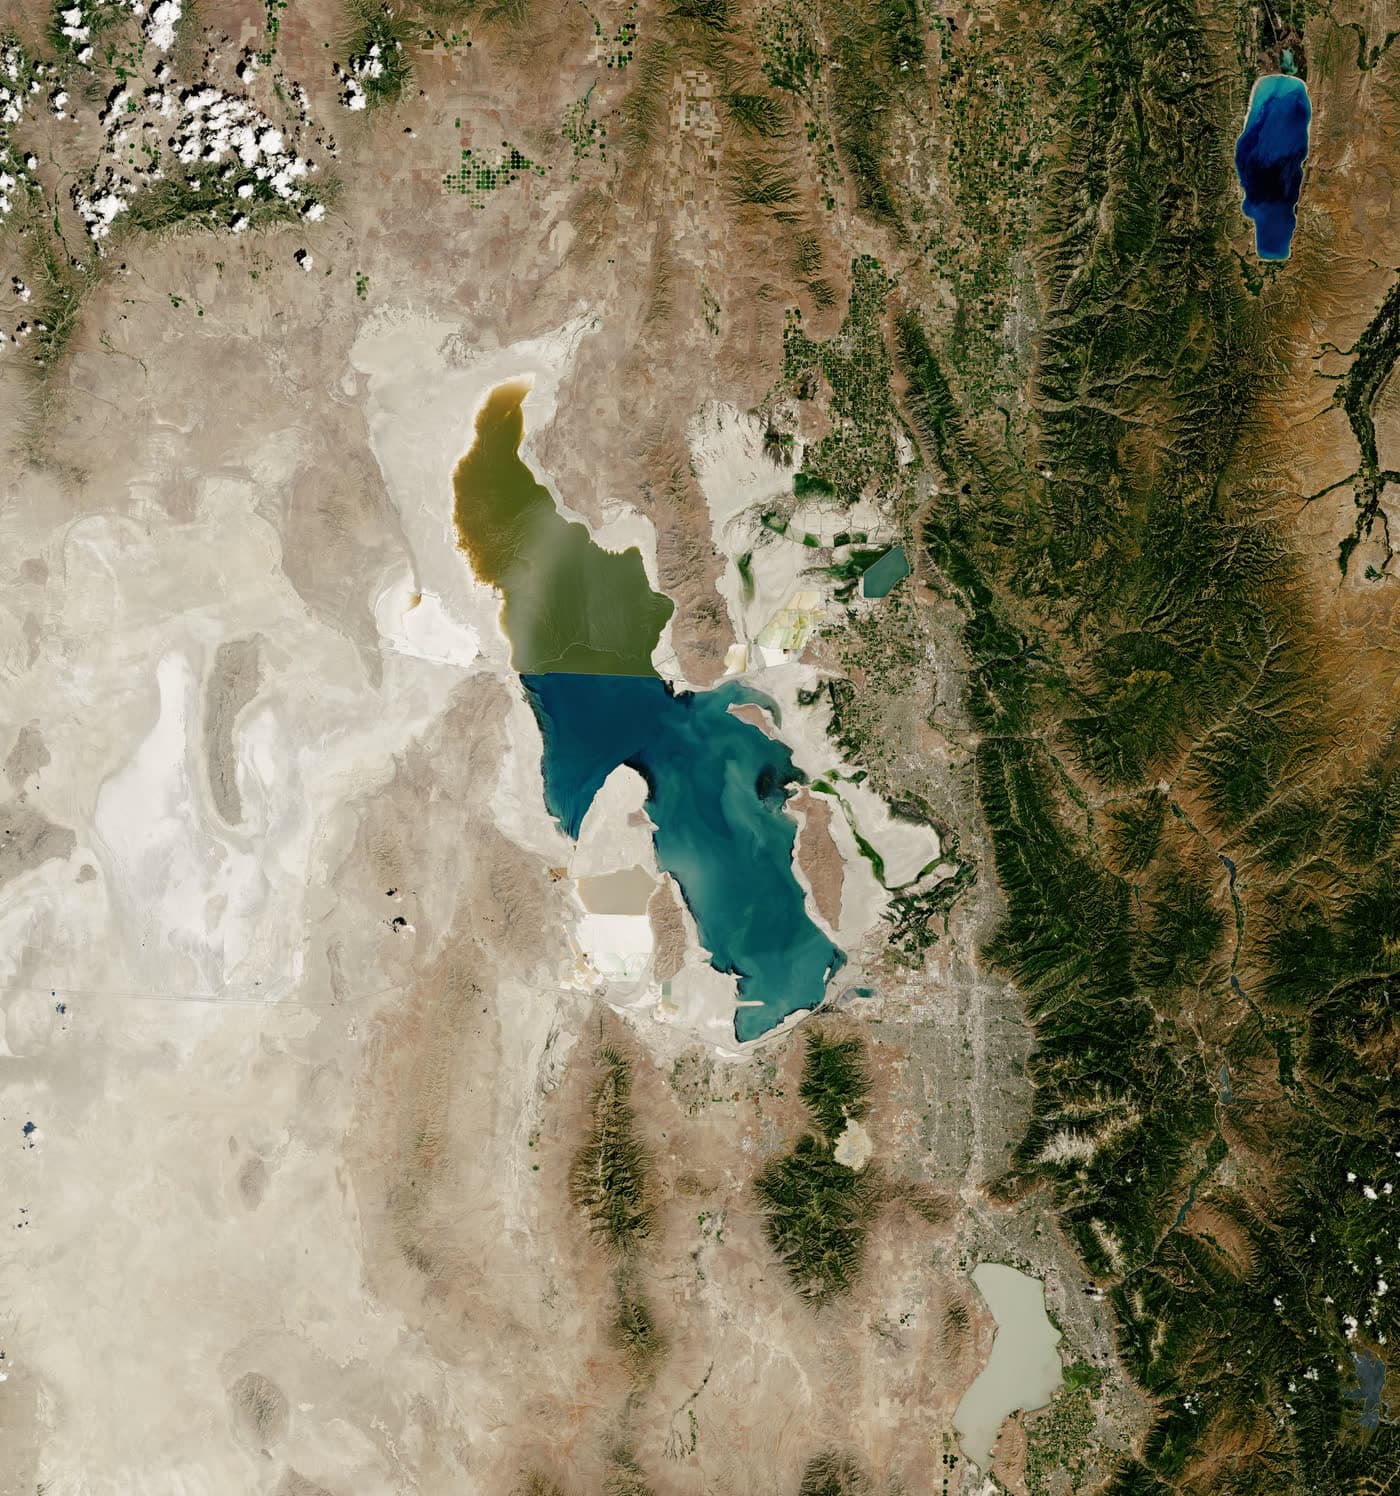
The same ground, photographed by Landsat satellites years apart. Drag the line to wipe from then to now.
about 19.5 feet lowerour math
In 1985 the lake was near its all-time high. By July 2022 it had hit a new record low. The pale ground around the shore is lakebed that used to be underwater.[30]
Want every year since 1984? Scrub through Landsat for any place on Earth in Google Earth Timelapse ↗
History of water in the West
Hoover Dam, Glen Canyon, Lake Mead and Lake Powell: the West has always built big to move water. This is the story Pacific Aquarius joins.
Approximate geography · illustrative route · exaggerated schematic relief, not measured elevations. Lake symbols show locations, not size or water level.
Before these dams, representatives met to negotiate how the Colorado River’s water would be shared. Santa Fe marks that chapter in this journey.
Representatives of seven basin states signed the compact in Santa Fe on November 24, 1922. It divided the Colorado River Basin into Upper and Lower Basins, using Lees Ferry as the dividing point.
A representative landscape locates the story; it does not reconstruct the signing venue. This short history is not a complete account of water rights or present operating rules.
Bureau of Reclamation · Colorado River Compact and basin geography
The canyon, the dam, the reservoir: Hoover brings three different scales into one view. Its construction story began before Lake Mead appeared.
Crews diverted the river around the construction site on November 14, 1932. Placement of the dam’s concrete began on June 6, 1933.
Water began collecting behind the dam on February 1, 1935. President Franklin D. Roosevelt dedicated the structure on September 30 that year.
A representative illustration of a dam in a canyon. Shapes, dimensions and the water surface are artistic; they do not reproduce Hoover’s exact geometry or current conditions.
Bureau of Reclamation · Hoover Dam chronology
Bureau of Reclamation · Hoover Dam location and construction
Upstream on the Colorado River, Glen Canyon Dam created Lake Powell. The dam’s construction and the reservoir’s filling unfolded over very different timescales.
President Dwight D. Eisenhower remotely triggered the first construction blast on October 15, 1956, from Washington, D.C.
Lake Powell began filling on March 13, 1963. That initial filling reached full pool on June 22, 1980, more than seventeen years later.
An artistic canyon-and-dam scene accompanies the history. It is not a measured reconstruction of Glen Canyon Dam, and the illustrated water does not show a current lake level.
Great Salt Lake belongs to a separate terminal basin. Its story is about the water reaching the lake and the water leaving through evaporation.
The Bear, Jordan and Weber rivers are the lake’s largest tributaries. Runoff, precipitation, temperature and evaporation shape its changing shoreline.
The lake and shoreline are representative artwork, not dated observations. This view establishes no water level, salinity, recovery forecast or benefit from adding seawater.
Pacific Aquarius imagines a connection between Pacific seawater and the Great Salt Lake. Here, the coast is a setting for that idea, not an identified intake site.
The shoreline, intake marker and any connecting line are original illustrations. They show no studied or approved route, selected parcel or committed project.
Marine effects, land access, energy, treatment and the lake’s response would need independent study. The scene makes no claim about feasibility, water delivery or environmental outcomes.
The Ute Indian Tribe is based on the Uintah and Ouray Reservation in northeastern Utah. The reservation lies within the Colorado River drainage.
In comments dated December 20, 2022, the Tribe called for direct participation in Colorado River management decisions. The linked document presents that request in the Tribe’s own words.
This representative basin landscape depicts no reservation boundary, cultural site or tribal architecture. The story makes no claim about current water allocations or settlement status.
Ute Indian Tribe · December 2022 comments, hosted by Reclamation
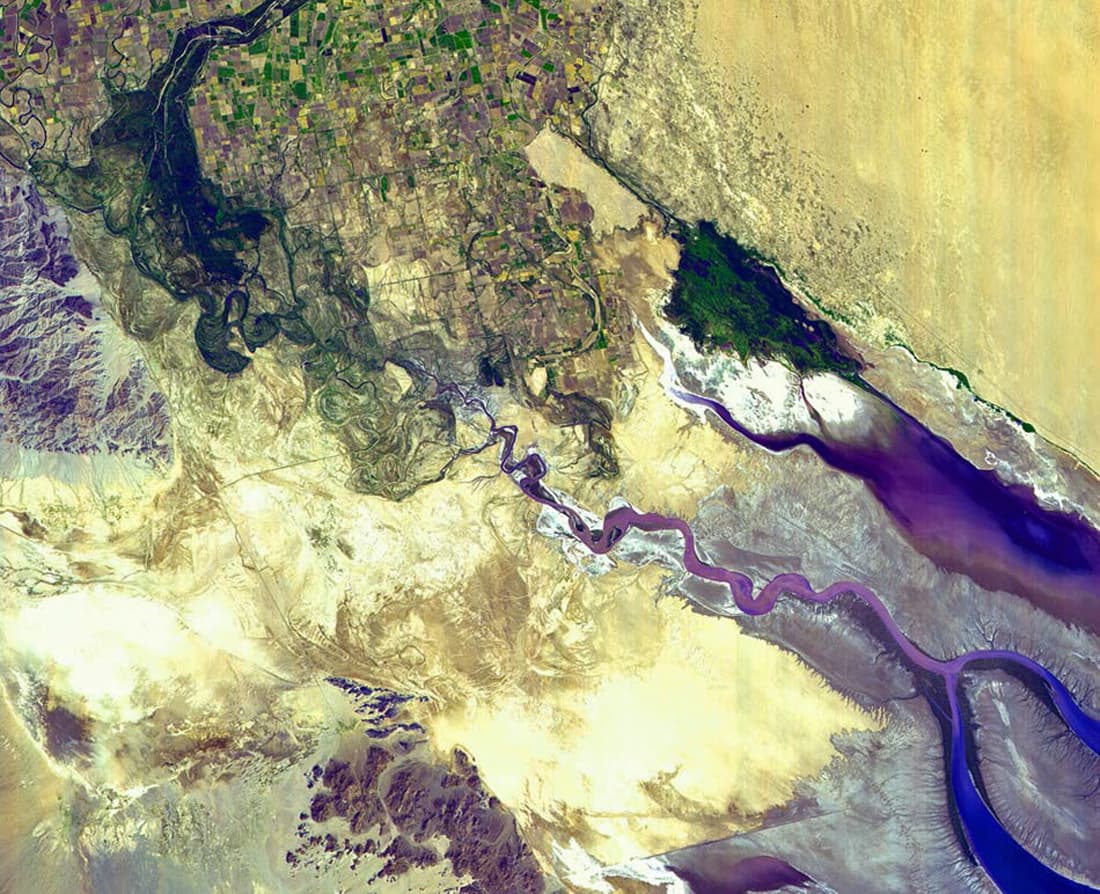
At the northern Gulf of California, the delta carries traces of branching channels and dry reaches. Two dated observations tell different chapters of that story.
A September 2000 satellite image, described by USGS, shows the Colorado River ending in desert sands before reaching the Gulf. It records a historical moment, not today’s conditions.
An environmental water release ran from March 23 to May 18, 2014. Researchers tracked its passage through the delta and documented water reaching the river’s estuary.
The branching channels, sand flats and sea are original illustrative forms. Their shape and wet or dry appearance are not a map, a live observation or a restoration forecast.
USGS · September 2000 Colorado River endpoint image
USGS · Field and satellite observations of the 2014 pulse flow
1908
In Winters v. United States, the Supreme Court holds that when the U.S. set aside reservations, it also reserved water for them: the Winters doctrine behind tribal water rights across the West.[21]
Who holds the water?
Thirty federally recognized tribes live in the Colorado River Basin. Twenty-two of them hold rights to about a quarter of the river’s yearly flow, yet tribes had no seat when the river was divided in 1922, or when the states rewrote the rules in 2007. Many now want a legally granted seat at the table.[22]
In Utah, the Ute Indian Tribe of the Uintah and Ouray Reservation holds reserved rights under the Winters doctrine. A compact Utah ratified in 2018 puts 248,943 acre-feet a year in trust for the Tribe and others, and says Congress and the Tribe must also ratify it.[21]
Downstream, Mexico is owed 1.5 million acre-feet a year by a 1944 treaty, and the river itself went years without reaching the sea.[27][28]
Our view: any new source of water for the West should start with the tribes at the table, not end with them.
Where the river ends
The Colorado starts as snow in the Rockies and once ran all the way to the Gulf of California. Dams and canals take it up along the way. By the time it crosses into Mexico, only about 10 percent of its water is left, mostly for farms. In a satellite photo from September 2000, the river simply fades into the desert sand before it reaches the sea.[29]
Mexico’s share is fixed by a 1944 treaty. In 2014 the two countries let a planned pulse of water run downstream, and for eight weeks the river touched its estuary again.[27][28]
Our view: same snow, same river, from the headwaters to the delta. Pacific Aquarius is aimed at the Great Salt Lake, a separate basin, but the lesson carries over: new water should leave everyone downstream better off, and the people at the end of the river belong in the conversation.
The idea, in three parts
A water system can be something people understand, experience, and care about. Pacific Aquarius explores what happens when infrastructure and a destination are conceived together.
Explore an Oregon Coast intake and a dedicated conveyance corridor to the Great Salt Lake.
The proposed systemBring hospitality, recreation, immersive attractions, and learning experiences into the waterworks vision.
The visitor experienceEvaluate whether visitor spending and potential water services could help fund construction and operations.
The business caseExplore the system
Four parts of a proposed system. Select a stage to see the idea and the question it must answer.
Source & marine environment
The proposal starts with a seawater intake on Oregon’s coast. Its location, intake technology, and marine protections would need site-specific study.
The question to answer
Where could an intake operate with acceptable marine impacts?
Read the system outlineProposed sequence only. No final alignment, system design, operating capacity, or environmental outcome is established by this illustration.
Ride along · The climb
Mile (of ~750)
0
Elevation
0 ft
Lift energy*
0
kWh / acre-ft
Schematic counters · illustrative profile, not a surveyed route
Mile 0, sea level
Seawater enters a screened intake on the coast.
Illustrative profile · see note below
Illustrative profile, shaped after Utah’s sketch of a Pacific route (700–800 miles, peaking at 7,232 ft).[1] An Oregon route’s real profile hasn’t been studied. *our math The least energy to lift one acre-foot of seawater to the highest point so far, with perfect pumps and no pipe friction. Real pumping needs much more.[7]
A ride along an illustrative elevation profile from the Pacific at sea level, over mountain passes near 7,232 feet, across the high desert, down to the Great Salt Lake at 4,191 feet. Lifting one acre-foot of seawater 4,200 feet takes at least about 4,400 kilowatt-hours.
More than a water system
The ambition draws inspiration from Disneyland’s immersive destination experience: a place people want to explore and return to, with the journey of water at its heart.
Independent concept. No Disney affiliation.
Open the concept galleryWaterfront hospitality, dining, and public spaces that invite a longer stay.
Recreation, immersive attractions, and landscape experiences built around water.
Exhibits, guided experiences, and learning programs that make infrastructure understandable.
Proposed visitor experiences. Locations, resort designs, operators, and programs have not been established.
The business case
That is the proposition to test. A viable venture must support both the water system and the destination over time.
Potential revenue
Whole-system costs
Profitability is a goal to evaluate. Demand, energy costs, capital requirements, and financing must be tested together.
Review planning assumptionsWhat it would take
A good proposal shows its hard parts. Here’s what researchers and the State of Utah have already found about piping ocean water to the lake.
A · It’s been studied
That’s how Utah’s Great Salt Lake Strike Team summed up importing ocean water in 2023. Their sketch: 500,000 acre-feet a year through a 13-foot pipe, 700–800 miles long, pumped over the Sierra Nevada at 6,500–7,000 feet. Cost: possibly more than $100 billion, and decades to build.[1]
B · Energy
A 2023 BYU study found that about 405,000 acre-feet a year needs at least 400 megawatts of pumps, roughly 11% of Utah’s electricity, costing over $300 million a year and nearly a million tonnes of CO₂.[7] At the concept’s 9.3-billion-gallon-a-day target, that scales to roughly 10 gigawatts, more than double Utah’s whole electricity use.our math
C · Scale
9.3 billion gallons a day is about 10.4 million acre-feet a yearour math, against the lake’s need of 0.5–1.1 million.[1] The rest would feed treatment and regional supply. For scale, the nation’s largest seawater desalination plant, at Carlsbad, makes about 50 million gallons a day.[10]
D · Salt
Seawater is about 35,000 parts per million salt.[11] If fresh water is taken out and the salt stays, the lake gets saltier.our math The Strike Team warned imported seawater could change the lake “in unanticipated ways.”[1]
E · Law and permits
A Pacific line crosses state borders and would likely need federal involvement,[1] which brings a full environmental review under NEPA.[14] The ocean intake and the water rights would each need their own approvals. In 2024 Utah set up a framework to seek water from outside the state, which may mean water-rights deals rather than a pipeline.[13]
G · Built for salt
Desalination plants already handle this: plastic (HDPE) pipe for seawater intakes and fiberglass for lower-pressure lines, with super-duplex stainless steel where the pressure is high.[23] The rest is maintenance, like the Navy: its Pacific and Atlantic fleets have put about a quarter of their maintenance budgets toward fighting corrosion.[24] And seawater isn’t clean just because it’s salty: it carries life that fouls pipes, so intakes need screening and treatment.
F · A cautionary tale
In 2022 an independent panel studied piping seawater to the shrinking Salton Sea. It found the idea technically possible but extremely expensive, decades away, and environmentally risky, and did not recommend it.[9] In 2023 Utah’s lake commissioner said a Pacific pipeline wasn’t among the options the state was weighing.[8]
Rough arithmetic from the cited sources, for scale only. Not an engineering estimate.[7][11]
Because the West’s water squeeze is a long-range problem, and big works start as conversations. The honest next step isn’t a pipeline. It’s an independent feasibility look at whether any version of this, at any size, could make sense next to conservation.
Current stage: concept
A concept dossier, proposed system outline, and preliminary planning assumptions.
Read the dossierEngineering, energy, environmental effects, water rights, permitting, and commercial demand.
Read the FAQDated studies, a documented assumptions register, and a milestone plan. No construction date is committed.
The published concept does not establish an approved route, secured water rights, financing, or an engineering design.
Historical precedent · Boulder Canyon Project
Method 01
Congress authorized and federally financed construction of the Boulder Canyon Project.
Method 02
Long-term hydroelectric power contracts were designed to repay federal construction costs with interest.
Method 03
Related metropolitan water works used separate public bond financing and water revenues.
Method 04
Engineering reports, jobs, progress films, tourism, and monumental imagery made the works visible.
Pacific Aquarius proposes a privately sponsored seawater system and destination resort. This precedent illustrates revenue-producing infrastructure; it does not establish funding or profitability for this proposal.
Go to the source
Explore observations from the agencies that monitor these water systems.
Current storage percentages and combined deficit totals are unavailable here while the data is verified. Use the official sources below for dated observations. Lake elevation alone does not establish stored water volume.
U.S. Bureau of Reclamation
Compare published reservoir storage, drought, and watershed conditions.
View official data for Colorado River reservoirsU.S. Bureau of Reclamation
Review storage, elevation, inflow, and release records from the operating agency.
View official data for Lake Powell and the Upper BasinState of Utah
Explore lake levels and watershed conditions from Utah’s official monitoring resources.
View official data for Great Salt LakeThese independent sources describe existing water systems. They do not endorse Pacific Aquarius or establish the feasibility of its proposed infrastructure.
Help shape the next chapter
Bring your questions, corrections, or supporting research. Let’s have a useful conversation about the proposal.
Pacific Aquarius
A concept sponsored by Chiller Tech Support LLC
Discuss the proposal Call (801) 244-6588Sources
Facts on this page link to the list below. Figures tagged “our math” are our own arithmetic from these sources, with the steps shown under “How we did our math” in the reality check. None of these organizations endorse Pacific Aquarius.
Music